ECONOMIC GROWTH: MIXED RESULTS
We are getting mixed results on the job front. Only 75,000 new jobs were added in May, below expectations. However in June this number surged to 224,000 which was considerably higher than expected. The unemployment rate was 3.7% which was near a 50 year low. Prior to this June report, it was expected that interest rates would be cut at the Federal Reserve’s July meeting. With this report, economists are not as certain this cut will take place in July.
Positive market returns and a strong jobs market support consumer confidence. A decline in confidence—despite the strong market returns—indicates that workers may be starting to worry. That said, confidence remains at high levels.
Although confidence may be down, it has not yet hit actual behavior or economic growth. In fact, consumers kept earning and spending. Personal income and personal spending were up by 0.5% and 0.4%, respectively, in May. Retail sales also grew by a healthy 0.5%.
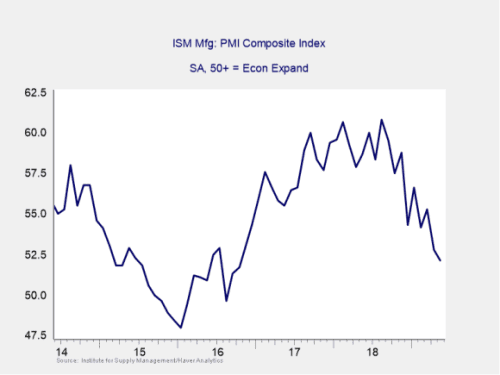
Businesses had a similar quarter, with some spending growth despite mixed confidence indicators. The Institute for Supply Management (ISM) Manufacturing index declined during the quarter. This drop reflects manufacturers’ growing concerns over a prolonged trade war. As you can see in Figure 1, the index is now at its lowest level in more than two years.
STRONG JUNE LEADS TO POSITIVE QUARTER FOR MARKETS
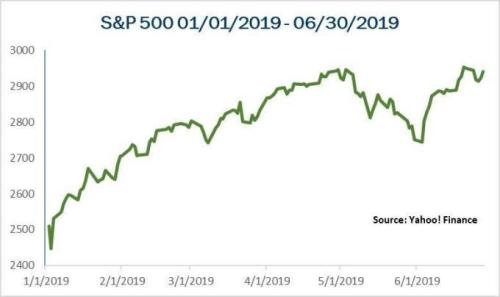
June was a great month for stocks, as all major equity markets saw positive returns. Further, June’s gains offset May’s declines, leading to positive quarterly performance of 4.3% for the S&P 500, 3.2% for the DJIA, and 3.9% for the NASDAQ.
This positive performance came despite weakening fundamentals. According to FactSet (as of June 28, 2019), the estimated earnings decline for the S&P 500 in the second quarter is 2.6%. This estimate is down from the 0.5% decline projected at the start of the quarter. Keep in mind that earnings declined in the first quarter for the first time since 2016. As such, this projected earnings decline for the second quarter in a row is concerning. Analysts project further declines in the third quarter before a return to growth in the fourth quarter. Ultimately, fundamentals drive long-term performance, so this is an area that deserves attention going forward.
The international story in June was much the same. Once again, these gains offset losses in May, bringing the MSCI EAFE Index to a 3.7% gain for the quarter. The MSCI Emerging Markets Index, which fell further than the developed markets in May, ended the quarter with a 0.7% gain.
Even fixed income had a positive June, driven by falling interest rates. Rates fell throughout the quarter, which led the Barclay Capital US Aggregate Bond Index to a quarterly gain of 3.1%.
Figure 1. ISM Manufacturing Index, 2014–Present
POLITICAL RISKS REMAIN
Although the economy continued to chug along, politics remained a concern, especially around trade. This impact was clear in May, when a couple of events rattled markets. First, we saw escalations in the China-U.S. trade war. Second, we had the surprise announcement of a blanket 5% tariff on all Mexican goods, although they never went into effect. On a more positive note, the G20 meeting at the end of June was drama free. World leaders toned down political rhetoric leading up to and during the meeting. This relative lack of political drama, along with a commitment for further trade negotiations between the U.S. and China, helped calm investor concerns and paved the way for June’s positive performance.
Despite the decline in sentiment, business investment and output continued to show steady growth. May’s industrial production report showed a 0.4% gain. This result was better than economist expectations. Core durable goods orders, a proxy for business investment, showed solid 0.3% growth in May. These results suggest the sector may be doing better than the sentiment indicates. The ISM Nonmanufacturing index was also positive. It held on to a higher level, suggesting that manufacturing was not a reflection of weakness in the economy as a whole.
The mixed confidence data was disappointing, but business investment continues and should have a positive impact on economic growth.
FED CONTINUES TO SUPPORT ECONOMIC EXPANSION
Another tailwind came from monetary policy. In a press conference after the Federal Reserve’s June meeting, Chairman Jerome Powell indicated that the Fed would continue to watch for any negative economic impacts from the ongoing trade war. Further, he said the Fed would step in with stimulative measures if necessary. Powell stopped short of saying that the Fed would cut rates at its next meeting. Still, market participants interpreted his comments as confirming the likelihood of a cut this year.
Inflation remains stuck below the Fed’s stated 2% target. But with slowing job growth and the rising concern around trade, a rate cut is certainly possible—and could be another tailwind for stocks.
ECONOMIC GROWTH POISED TO CONTINUE
All in all, this was a positive quarter for the U.S. economy. Despite concerns over international trade, the economy continues to grow at a solid clip. Consumers continue to show that they are willing and able to spend, and businesses are doing the same. Earnings declined in the first quarter and will likely do so again in the second quarter, but a return to growth by year-end should help support long-term performance.
Lower interest rates should support faster growth going forward, as lowered borrowing costs spur economic activity. We saw a surge in mortgage applications once rates fell in June. If rates remain low, there is a possibility that we could see housing growth return in the second half of the year.
Despite the very real political risks, the U.S. economy continues to grow. Markets have had a great start to 2019. Equities saw positive returns in five of the first six months of the year. These strong returns led all three major indices to double-digit year-to-date returns. There is a good chance that trend will continue. That said, the declines in May show that despite the positive tailwind from a growing economy, market volatility can come at any time. Thus, we continue to believe a well-diversified portfolio that matches your goals and risk tolerance remains the best way forward in a volatile world.
Presented by Alexandra Armstrong, CFP®, CRPC®

All information according to Bloomberg, unless stated otherwise.
Disclosure: Certain sections of this commentary contain forward-looking statements based on our reasonable expectations, estimates, projections, and assumptions. Forward-looking statements are not guarantees of future performance and involve certain risks and uncertainties, which are difficult to predict. Past performance is not indicative of future results. Diversification does not assure a profit or protect against loss in declining markets. All indices are unmanaged and investors cannot invest directly into an index. The Dow Jones Industrial Average is a price-weighted average of 30 actively traded blue-chip stocks. The S&P 500 Index is a broad-based measurement of changes in stock market conditions based on the average performance of 500 widely held common stocks. The Nasdaq Composite Index measures the performance of all issues listed in the Nasdaq Stock Market, except for rights, warrants, units, and convertible debentures. The MSCI EAFE Index is a float-adjusted market capitalization index designed to measure developed market equity performance, excluding the U.S. and Canada. The MSCI Emerging Markets Index is a market capitalization-weighted index composed of companies representative of the market structure of 26 emerging market countries in Europe, Latin America, and the Pacific Basin. It excludes closed markets and those shares in otherwise free markets that are not purchasable by foreigners. The Bloomberg Barclays Aggregate Bond Index is an unmanaged market value-weighted index representing securities that are SEC-registered, taxable, and dollar-denominated. It covers the U.S. investment-grade fixed-rate bond market, with index components for a combination of the Bloomberg Barclays government and corporate securities, mortgage-backed pass-through securities, and asset-backed securities. The Bloomberg Barclays U.S. Corporate High Yield Index covers the USD-denominated, non-investment-grade, fixed-rate, taxable corporate bond market. Securities are classified as high-yield if the middle rating of Moody’s, Fitch, and S&P is Ba1/BB+/BB+ or below.
Authored by Brad McMillan, CFA®, CAIA, MAI, managing principal, chief investment officer, and Sam Millette, senior investment research analyst, at Commonwealth Financial Network®.
©Commonwealth Financial Network®