An old foe returned in the fall of 2021, one we had not seen in more than 30 years, as inflation arrived abruptly after years of lying dormant. The Consumer Price Index (CPI), the primary measure of inflation, rose 7.0% in December. This was the first-time prices increased more than 6% since 1990, awakening memories of the persistent inflation that haunted the 1970s.
These elevated inflation numbers raise several concerns that can be roughly distilled to two questions. How long will this last? And what should we do about it?
CURRENT ENVIRONMENT
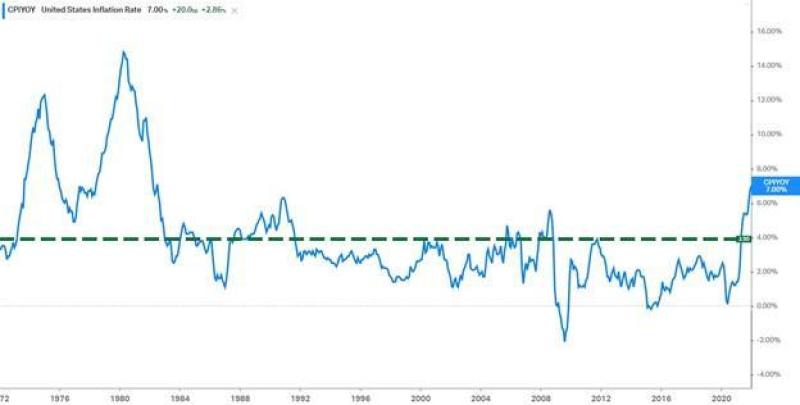
The chart above illustrates annual inflation going back to 1971, in blue. The dashed green line shows the average inflation rate (3.9%) since 1971. As we can see, in any given year the experience has been far from average. In fact, aside from blips in 2004 and 2008, inflation has been below the 3.9% annual average for the past 30 years, and for much of that time has been below 3.0%.
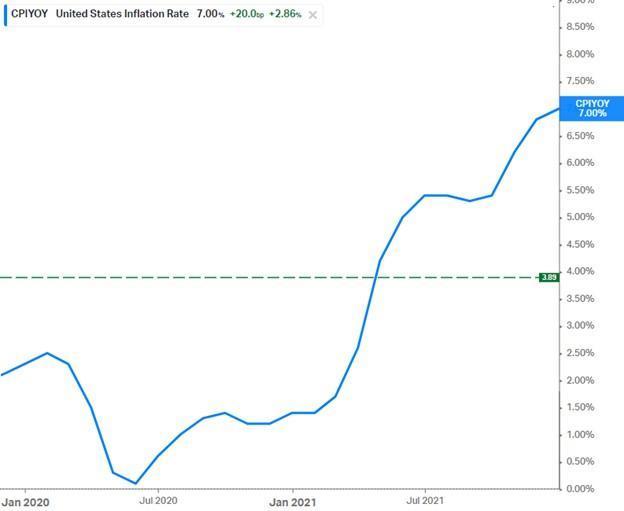
Inflation was still well below average as we entered the spring of 2021, before ticking up to 4.2% in April. During the summer, the pace picked up with prices rising between 5.0% and 5.4%, before jumping further in the Fall to reach the current 7.0% inflation rate. We can more easily see this progression if we zoom in to the last two years:
A few months of inflation are hardly cause for panic, and there is an obvious catalyst for inflation in the pandemic related supply chain issues. But it is reasonable to wonder where all this is headed. Our two most recent, sustained bouts with inflation provide some context.
HISTORICAL CONTEXT PART 1 – 1970S
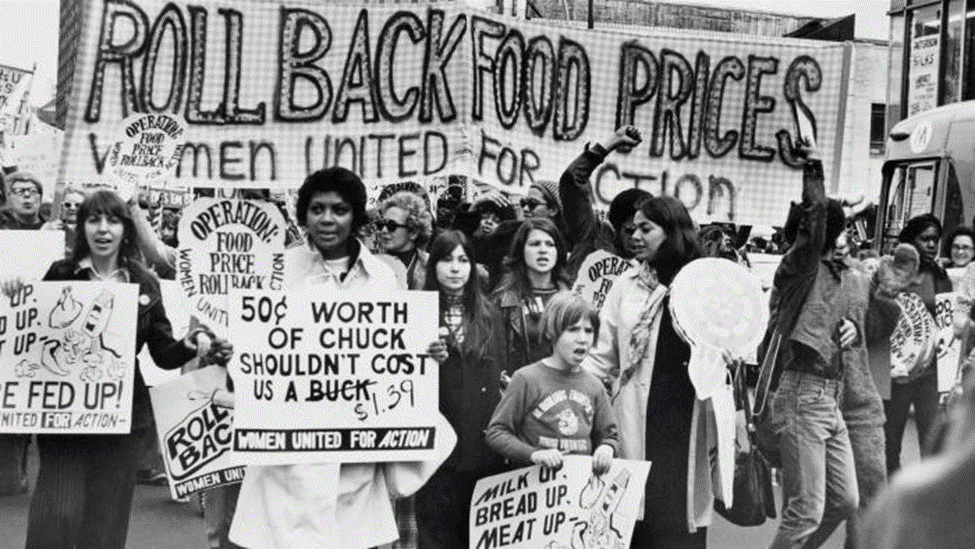
For many of our seasoned clients this no doubt triggers memories of the inflation challenges of the 1970s. Bookshelves have been filled with studies and debates over what caused the persistent inflation of the 1970s, and why it was so difficult to control. While we don’t need to wade too deep into those waters, it is useful to revisit what led up to inflation hitting a peak of 14.8% in March 1980.
In the mid-1960s, a wave of new government programs introduced under the Johnson administration, along with the escalation of the conflict in Vietnam, led to a significant increase in government spending. Typically, new spending stimulates the economy, but the economy was already near full employment, so prices, rather than jobs, began to grow.
In the 2000s, we were used to a tight link between Federal Reserve interest rates and general lending rates on things like homes and cars, but this was not the case 50 years ago. The Federal Reserve, wary of stalling the economy, kept their interest rates low and the supply of money flowing. This only caused further inflation, as the economy ran hot.
Banks and lenders, wary of this inflation, began raising rates on their own. As this cycle continued, the center could not hold, and the economy began to deteriorate. In a previously unheard-of development, unemployment rose, and the economy stagnated while inflation rose, giving rise to the new and unpleasant term stagflation.
From there wage and price controls, the end of the gold standard, oil embargoes, and a general energy shortage all contributed to extending high inflation through to 1980.
The tide was finally turned when new Federal Reserve Chairman Paul Volcker orchestrated a series of interest rate hikes in 1980, sending the economy into a brief, but painful recession. While the recession was deep, with unemployment jumping above 10%, it had the desired effect on inflation. Inflation dropped to 10% in 1981, and stepped down from there, hitting 6.2% in 1982 and 4.1% in 1983.
With the benefit of hindsight, the Federal Reserve has written that their policies in the late 60’s and 70’s made the situation worse, and this has informed their actions in the crises since then. While the 1970s era of stagflation is our most recent experience with sustained inflation, it may not be the most instructive for our current predicament.
HISTORICAL CONTEXT PART 2 – 1940S
The period that most closely resembles our current situation is the immediate aftermath of World War II. During the war, nearly all manufacturing capability was focused on defense. Production of durable goods like homes, cars, and appliances essentially ceased.
This, along with rationing and price controls during the war led to personal savings that had accumulated significantly by 1946. With GI’s returning home, starting families and migrating to the suburbs, there was significant pent-up demand for goods, but no supply. It took time to retool factories and get production lines churning out consumer goods once again.
Thanks to the shortage of goods, prices (and thus inflation) began to rise. We are seeing a clear echo of this situation at present, with a constrained supply chain and a flight to the suburbs leading to a shortage of homes and goods, and thus higher prices. If you’ve tried to buy a car, renovate a home, purchase an appliance, or even buy bacon, you’ve seen this firsthand.
If we circle back to the 1940s, we see price increases enabled companies to make more money, with corporate profits rising 20%. As a result, labor unions demanded wage increases, and by July 1946, fully 3% of the entire labor force in the U.S. was on strike.
Here again, we can draw a line to our present situation. One of the great secondary stories of 2021 was the “great resignation.” In an echo of the 3% strike rate in 1946, the quit rate reached 3% of the total work force in September 2021 according to Forbes. Rather than striking for better wages and benefits, workers are changing jobs or striking out on their own thanks to the internet and the rise of the gig economy.
Unlike the 1970s, in the aftermath of World War II there was little direct government intervention to combat inflation. Inflation remained high in 1947 and into 1948. After more than two years, U.S. and foreign manufacturing and supply chains had finally returned to full capacity, and demand began to level off to more normal levels. As a result, beginning in September 1948 supply and demand began to regain some balance, inflation started to fall, and more or less remained muted until the 1970s.
WHAT’S NEXT?
While every era has its unique challenges, it appears the current situation more closely resembles the post-war period. While raising interest rates can cool the economy and thus tamp down inflation, that does not seem to be the answer to the current predicament.
The Federal Reserve has signaled it expects to raise rates two to three times this year. But they are expected to be small increases aimed at getting rates back above zero and returning to a more normal historical level. The Fed isn’t planning to raise rates specifically because of inflation, though it may speed up the timeline. The bottlenecks in the supply chain are the main driver of inflation, and raising rates won’t bring container ships into port, offload them onto trucks, and get them out for delivery any faster.
It seems more likely that we will need time to work through the supply chain back log, as we did in 1946-48, before inflation moderates. In a December report, Goldman Sachs expressed a similar viewpoint, illustrated in the chart below.
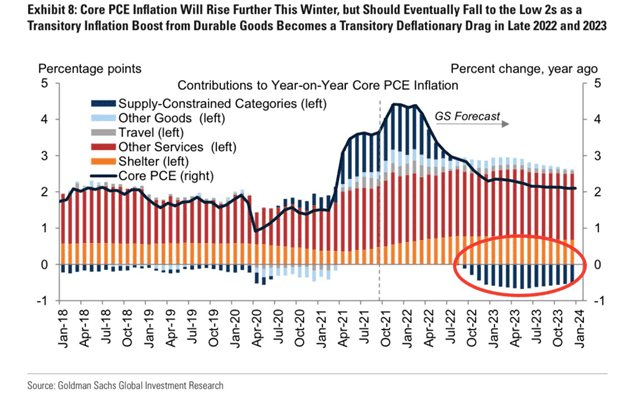
While the chart is busy, the focus is on the dark blue bars, what Goldman calls “supply-constrained categories.”
The chart shows these goods contributing to the rise in inflation beginning in April 2021. According to their forecast, they expect this to continue to be the case through April 2022.
From there, they expect the supply chain to free up and for prices on those goods to drop, slowing down inflation. Lastly, they highlight in the red circle their expectation that the price on those goods will begin to fall in late 2022, dragging the overall inflation rate down near 2%.
Goldman Sachs expects our path towards lower inflation to be a sped-up version of 1946-48. What remains to be seen is whether the supply chain issues are cleared as quickly as they expect. It is certainly possible that Omicron (or other variants) could disrupt that timeline by slowing down the return to normal. It seems clear that at the very least inflation will be with us for a good portion of 2022.
WHAT DO WE DO ABOUT IT?
If the current levels of inflation do indeed last just a few months more, the effect on your finances and your investments will be minimal in the long run. Even if inflation sticks around longer, for most the best action will be to stay the course.
There is no magic bullet in investing when it comes to inflation, but historically the assets that perform best when inflation rises have been U.S. stocks, international stocks, and real estate.
Commodities, natural resources, and gold are often thought of as good inflation hedges, but their historical record is inconsistent. Despite the recent jump in inflation, gold declined 4.0% in 2021, and has not produced a positive return vs. inflation since the early 1970’s. Even worse, according to Nick Maggiulli since 1976 when inflation was above 4%, commodities posted a return after inflation of -5.5% per year.
We build our financial plans and portfolios with inflation in mind. We model our plans using higher inflation assumptions than average to plan for something like this. We allocate your portfolios to a wide range of investments that thrive under different scenarios. Our job is to worry about these things ahead of time and put you in a position so that you don’t have to.
We expect inflation to remain in the headlines well into 2022 and think that it will simply take time to return to normal as we continue to restart the economy. In the meantime, we will keep a watchful eye on inflation, and be ready to talk through how it may affect you directly at any time.
Presented by Christopher Rivers, CFP®